Monitoring
Every app tells you when it breaks. And your assistant can fix it.
Every app on Croft comes with monitoring built in. No SDK, no agent, no dashboards to set up, no extra cost. When something breaks you get an email - and your AI assistant can see the error, fix it, and deploy the fix.
The problem
You built an app by talking to AI. When it breaks, neither of you knows why.
Your team sees "something went wrong." Your assistant sees nothing at all. Traditional APM - New Relic, Datadog, Sentry - needs an account, an SDK, and usually an engineer. That does not fit someone who built an app in an afternoon by conversation.
Croft gives you the basics of APM and error tracking, built in, for people who would never set one up - and lets your assistant see and fix what broke.
Built into every app
Nothing to install. Nothing extra to pay.
Your app runs; Croft records what matters. Response times, errors, resource usage, logs - all up to the minute, all included.
Overview at a glance
See every app in your workspace: requests, failure rate, average response time, health, open errors, server CPU and memory - one dashboard for everything you run.
Response time breakdown
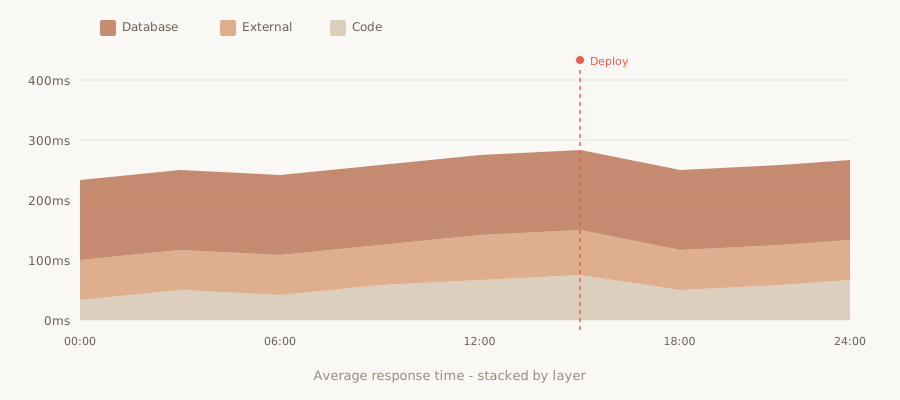
For apps on the Croft runtime: see where time goes with a stacked breakdown of database, external API calls, and code execution - the same New Relic-style profiling, built in.
Error groups with stack traces
Croft auto-groups errors by type and location. Click into any group for the stack trace, which requests failed, and a Fix with Build button - or copy the error to your assistant.
Slow requests and SQL
Waterfall views of your slowest requests, showing exactly which database queries or API calls took the time, plus a list of your slowest SQL queries to optimise.
7 days of logs
Search logs by level, time, or keywords, right in the panel. Your assistant can read them over MCP to diagnose and fix issues you describe in chat.
Health checks and resources
Track your app's health check, server CPU, memory, and database size over time. Charts include deploy markers, so you can see exactly when a change went out.
Where time goes
See which part is slow - database, external, or code.
For apps on the Croft runtime, response time is broken down into database queries, external API calls, and your own code execution - the same profiling enterprises rely on to find bottlenecks.
Throughput and failures
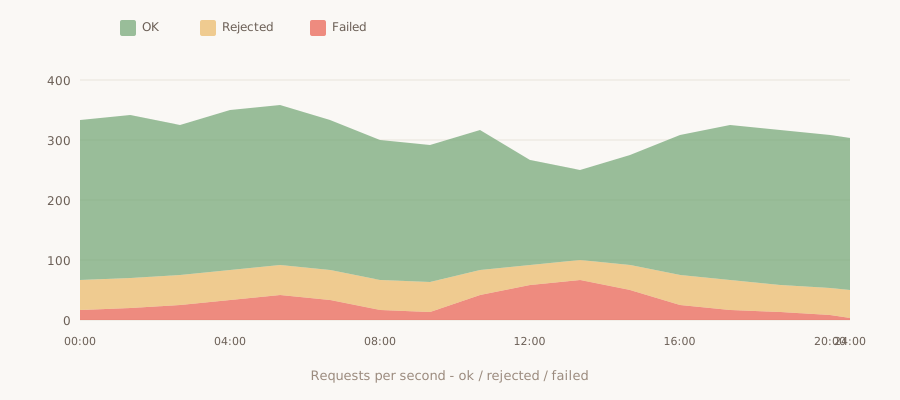
Know when things break, and how often.
Track ok, rejected, and failed requests over time. Spot patterns, see spikes, and catch problems before your users tell you.
The fix loop
Your assistant can read the error, fix it, and redeploy.
When an app breaks, your AI assistant can see the error via MCP, read the logs and stack trace, fix the code it wrote, and deploy the fix - usually before you've made tea.
Errors auto-group
Croft groups errors by type and location. The same error from a hundred requests shows as one group, so you see the real count of distinct problems, not a flood of duplicates.
Fix with Build
Click Fix with Build on any error and it hands the stack trace, logs, and context to Croft Build - the built-in AI chat - which fixes and redeploys. Or copy the error and paste it to your own connected assistant.
Auto-resolve after a good deploy
Ship a fix and the error group auto-resolves when Croft sees no new occurrences in the next deploy. No manual triage, no stale open errors cluttering the list.
Alerts
Get an email when something breaks, not a hundred.
Croft sends alert emails for new errors, high failure rate, and when an app becomes unhealthy - once per app per day at most, with a Fix with Build link in every alert.
New error
The first time Croft sees an error it has not grouped before, you get an email with the stack trace and a Fix with Build link.
High failure rate
When a large percentage of requests fail over a short window, you get one alert - not one per request - with the failure count and Fix with Build.
App unhealthy
If your app's health check fails or the app stops responding, you get an alert. Once the app recovers, you get a confirmation email.
Privacy
Detailed telemetry stays on your server.
Logs, errors, stack traces, and slow request traces live on your own Croft server, with 7-day retention. Only aggregate counts and timings - requests per second, average response time, failure rate - go to the control plane for charts.
No query strings, request bodies, cookies, or IP addresses are recorded. Your telemetry is yours.
For AI assistants
Claude, ChatGPT, and Build can read errors and logs.
The Croft MCP includes monitoring tools - app_errors, app_metrics, logs - so your connected assistant can diagnose and fix issues you describe in chat, with full context.
app_errors
Your assistant can list open error groups, read stack traces, and see which requests failed - the same view you get in the panel.
app_metrics
Ask about response time, throughput, failure rate, or server resources, and your assistant fetches the current metrics for any app.
logs
Your assistant can search and read the last 7 days of logs, filtered by level or keywords, to diagnose what you describe.
Included
Built in on Solo and Team. No usage pricing.
Monitoring is included on every Croft plan - Solo, Team, and Enterprise - with no separate bill, no usage meter, and no upgrade to unlock it. Your apps come with monitoring the day you deploy them.
FAQ
Frequently asked questions
What monitoring features does Croft provide?
Every app gets response time tracking (with database / external / code breakdown for apps on the Croft runtime), throughput and failure rate charts, error grouping with stack traces, slow request traces, 7 days of searchable logs, health checks, server resource monitoring, and alert emails - all built in, nothing to install.
Do I need to add an SDK or agent to my app?
No. Monitoring is built into the platform. Your app runs; Croft records what matters - response times, errors, resource usage, logs - without any code changes or libraries to add.
How does error tracking work?
Croft auto-groups errors by type and location, showing you stack traces and which requests failed. When you fix and deploy, error groups auto-resolve. Your AI assistant can read errors via MCP tools, fix the code, and redeploy - often before you’ve looked.
What alerts do I get?
Alert emails for new errors, high failure rate, and when an app becomes unhealthy - once per app per day at most, so you’re informed but not flooded. Each alert includes a Fix with Build link so your assistant can help.
Where does the monitoring data live?
On your own Croft server. Detailed telemetry - logs, errors, stack traces - stays on your server, with 7 days of retention. Only aggregate counts and timings go to the control plane for charts. No query strings, bodies, cookies, or IPs are recorded.
Does monitoring cost extra?
No. Monitoring is included on Solo and Team plans, with no usage pricing or separate bill.
Stake out your croft.
Your team's first app could be live before lunch.
Get your croft7 days free, no card to start. From $24/month - cancel anytime and take everything with you.